It's late January. The "$10 off your second order" code you sent to BFCM first-time buyers shows 176 redemptions and more than $12,000 in sales. Your team is calling it a win.
But some of those customers were coming back anyway, and every one of them still got $10 off. Shopify's discount report counts who used the code. It can't tell you which orders the offer actually caused, and that's the number you need to measure incremental revenue.
Small differences decide whether an offer pays. In Ometria's analysis of its retail clients, only 4% of Black Friday 2024 new customers made a repeat purchase within 12 months. When the natural repeat rate is that low, a handful of extra orders can look like a big result, and so can random noise.
Here's the short version: hold back a random group of eligible customers who don't get the offer, then compare repeat purchases and margin between the two groups. This guide covers the six numbers to compare, a setup that uses only Shopify and a spreadsheet, a worked example, and what to do when your store is too small for a clean answer. It's the hands-on version of the Q1 measurement stage of a holiday retention plan.
Short answer: A retention offer caused a repeat purchase only if customers who got it bought again more often than similar customers who didn't. To measure incremental revenue, randomly hold back 10% to 30% of eligible customers, send the offer to the rest, and compare repeat purchase rate and contribution margin per customer between the two groups over the same 60 to 90 days.
TL;DR
Redemptions count everyone who used the code, including customers who would have bought anyway, so they overstate what the offer caused.
A holdout group is a random slice of eligible customers who get no offer, and it shows what would have happened without one.
Compare per-customer results, not totals: repeat rate, contribution margin after the discount, time to second order, and full-price repeat rate.
Work out your break-even lift before sending, so you know how big a difference the offer needs to pay for itself.
Shopify segments, customer tags, and an orders export are enough to run the test, and a discount app like DiscountRay can deliver the offer to the test group only.
Small groups give noisy answers, so treat one test as a direction and repeat it before you change your whole Q1 plan.
Why Redemptions Don't Prove Your Retention Offer Worked
Redemptions tell you who used the offer, not who changed their behavior because of it. Every redeemer falls into one of three groups, and only one of them is a real gain.
Would have bought anyway. These customers were already planning a second order. The offer gave them money for something they were going to do, so their discount is pure cost.
Persuaded. These customers bought because of the offer. They're the incremental repeat purchases you're paying for.
Pulled forward. These customers would have bought in March and bought in January instead. The offer moved the date, not the total.
A redemption report mixes all three. It can also miss part of the effect. In 70 field experiments on emailed discount offers, Sahni, Zou and Chintagunta found the offers raised average spending by 37.2%, but 90% of that gain came from purchases that didn't use the offer at all. Some people saw the email, remembered the store, and bought at full price. A redemption count would credit the offer with none of those orders.
So redemptions can overstate the effect and understate it at the same time. "Attributed revenue" in an email tool has the same blind spot, because it counts orders that followed a message, not orders the message caused. That's why a high redemption rate that still loses money is so common after BFCM: the code got used, but mostly by people who didn't need it.
What Incremental Revenue Means for a Retention Offer
Incremental revenue is the revenue your offer group produced above what a comparable group with no offer produced, over the same period. You find it by comparing the two groups per customer, then multiplying the difference by the size of the offer group.
Two terms do most of the work:
Exposed group: the eligible customers who received the offer.
Holdout group: a random set of eligible customers who received no offer. They show your baseline, meaning what the exposed group would have done without the discount.
The key word is random. If you hand-pick the holdout, or compare redeemers with non-redeemers, the groups were different before the offer went out, and the comparison measures that difference instead of the offer.
Redemption report | Holdout comparison | |
|---|---|---|
Question it answers | How many people used the code? | How many extra people bought because of the offer? |
Counts customers who would have bought anyway? | Yes, as wins | No, they cancel out against the holdout |
Catches buyers who didn't use the code? | No | Yes |
Includes the cost of the discount? | Usually not | Yes, if you track margin |
Setup needed | None | A random split before you send |
The Holdout Scorecard: Six Numbers to Compare
The Holdout Scorecard is the set of six numbers you calculate for each group at the end of the test. Always compare rates and per-customer figures, because the groups are different sizes.
Metric | How to calculate it for each group | What it tells you |
|---|---|---|
1. Repeat purchase rate | Customers with at least one order in the window ÷ customers in the group | The basic "did they come back?" number |
2. Incremental repeat-purchase lift | Exposed repeat rate minus holdout repeat rate, in percentage points | How many extra customers per 100 the offer brought back |
3. Incentive cost | Every discount given in the exposed group, plus the cost of free gifts or free shipping | What you paid, including to people who'd have bought anyway |
4. Contribution margin per customer | (Net sales minus product cost, shipping and fulfillment, and payment fees) ÷ customers in the group | Whether the extra orders covered the incentive cost |
5. Time to second order | Median days from first order to second order, for customers who came back | Whether the offer sped people up, or only moved a date |
6. Full-price repeat rate | Customers who placed an order with no discount ÷ customers in the group, during the test and for 60 to 90 days after it ends | Whether the offer trained people to wait for the next code |
Two numbers come out of the Scorecard:
Incremental contribution = (exposed contribution per customer minus holdout contribution per customer) × exposed group size.
Cost per incremental repeat customer = incentive cost ÷ incremental repeat customers.
Contribution margin matters more than revenue here, because a discount lowers the profit on every order it touches. If you haven't worked out your profit margin after a discount per order, do that first, using the same costs for both groups.
The sixth number is easy to skip, and you shouldn't. In three large field experiments by Anderson and Simester, deeper discounts increased future purchases by first-time customers but reduced future purchases by established customers. An offer can look good in January and cost you full-price orders in April, so keep measuring after the code expires.
Before You Send: Work Out Your Break-Even Lift
Break-even lift is the smallest improvement in repeat rate your offer needs to pay for its own discount. Work it out before the campaign, so you know whether the offer even has a realistic chance.
Break-even lift = expected incentive cost ÷ (contribution per repeat order × exposed group size)
Here's an illustrative example. You'll send $10 off to 1,600 customers, and you expect about 176 of them to redeem it, so the expected incentive cost is $1,760. A typical second order is $70, and after product cost, shipping, and payment fees it leaves $31.50 in contribution margin.
$1,760 ÷ ($31.50 × 1,600) = 0.035, or 3.5 percentage points.
So if your normal repeat rate for this group is 9%, the offer has to lift it to about 12.5% just to cover the discounts. If that seems unlikely, make the offer cheaper (free shipping or a smaller fixed amount), or narrow it to the customers least likely to come back on their own.
How to Measure Incremental Revenue From a Retention Offer
To measure incremental revenue, you pick one group and one goal, split the group at random, give the offer to one side only, and compare both sides after the same window. These seven steps use Shopify's own tools and a spreadsheet.
Step 1: Pick One Group and One Job
Choose a single group with a single goal, such as "BFCM first-time buyers, second order by early April." Mixing first-timers, lapsed customers, and VIPs in one test hides what happened in each group.
Clean the group before you split it. If you can identify gift buyers, consider leaving them out, because gift orders that don't reflect the buyer's own taste behave differently in Q1. Also remove anyone who's owed a service recovery offer after a late or damaged order. Those customers get their gesture no matter what, so they don't belong in a test.
Step 2: Build the Segment in Shopify
Create a customer segment for the group. For BFCM first-timers, a filter like this works, using the Shopify segment query language:
number_of_orders = 1 AND first_order_date BETWEEN 2026-11-20 AND 2026-12-02
Adjust the dates to your own BFCM window. Build the segment the day you split, because customers who place a second order before then shouldn't be in the test.
Step 3: Split the Group at Random
Export the segment as a CSV, add a column with a random number for each row (=RAND() in Google Sheets or Excel), and sort by that column. Mark the first 20% as the holdout and the rest as exposed. Then copy the values so the random numbers stop changing.
Never split by engagement, spend, location, or alphabet, and never move a customer between groups after the split. Write down the date and the size of each group.
Step 4: Tag Both Groups
Add a customer tag to each group, such as q1-26-offer and q1-26-holdout. You can add tags with Shopify's bulk editor or a tagging app.
Be careful with CSV imports. Shopify's Help Center notes that importing with the overwrite option replaces all of a customer's data, including their tags, so an import can wipe tags your other apps rely on.
Step 5: Send the Offer to the Exposed Tag Only
Make the discount available only to customers tagged q1-26-offer. In Shopify you can limit a code to specific customers or customer segments, with one use per customer and an end date. Codes locked to one customer are best, because a code shared on a coupon site can reach your holdout and blur the result.
Give the offer a fixed window, such as January 6 to February 2, and don't change the amount once it's live.
Step 6: Keep the Message the Same for Both Groups
If you can, send both groups the same January email and leave the offer out of the holdout's version. That way the test measures the discount, not the reminder. Many stores find the email alone brings some customers back.
If you send nothing to the holdout, the test measures "email plus offer" together. That's still useful, but say so when you report the result.
Step 7: Read the Results at the End of the Window
Use the same window for both groups, for example January 6 to April 5. Then gather two things.
Repeat counts. A segment such as
customer_tags CONTAINS 'q1-26-holdout' AND last_order_date >= 2027-01-06shows how many holdout customers ordered again. Run the same filter for the exposed tag.Revenue and margin. Export your orders for the window. The file includes each order's email, subtotal, discount amount, total, and refunded amount. Match the emails to your two group lists and total each group.
One detail to watch: the export's Discount Code column doesn't include automatic discounts, but the Discount Amount column still shows what was taken off. Subtract refunds before you calculate margin.
A Worked Example: 2,000 BFCM First-Time Buyers
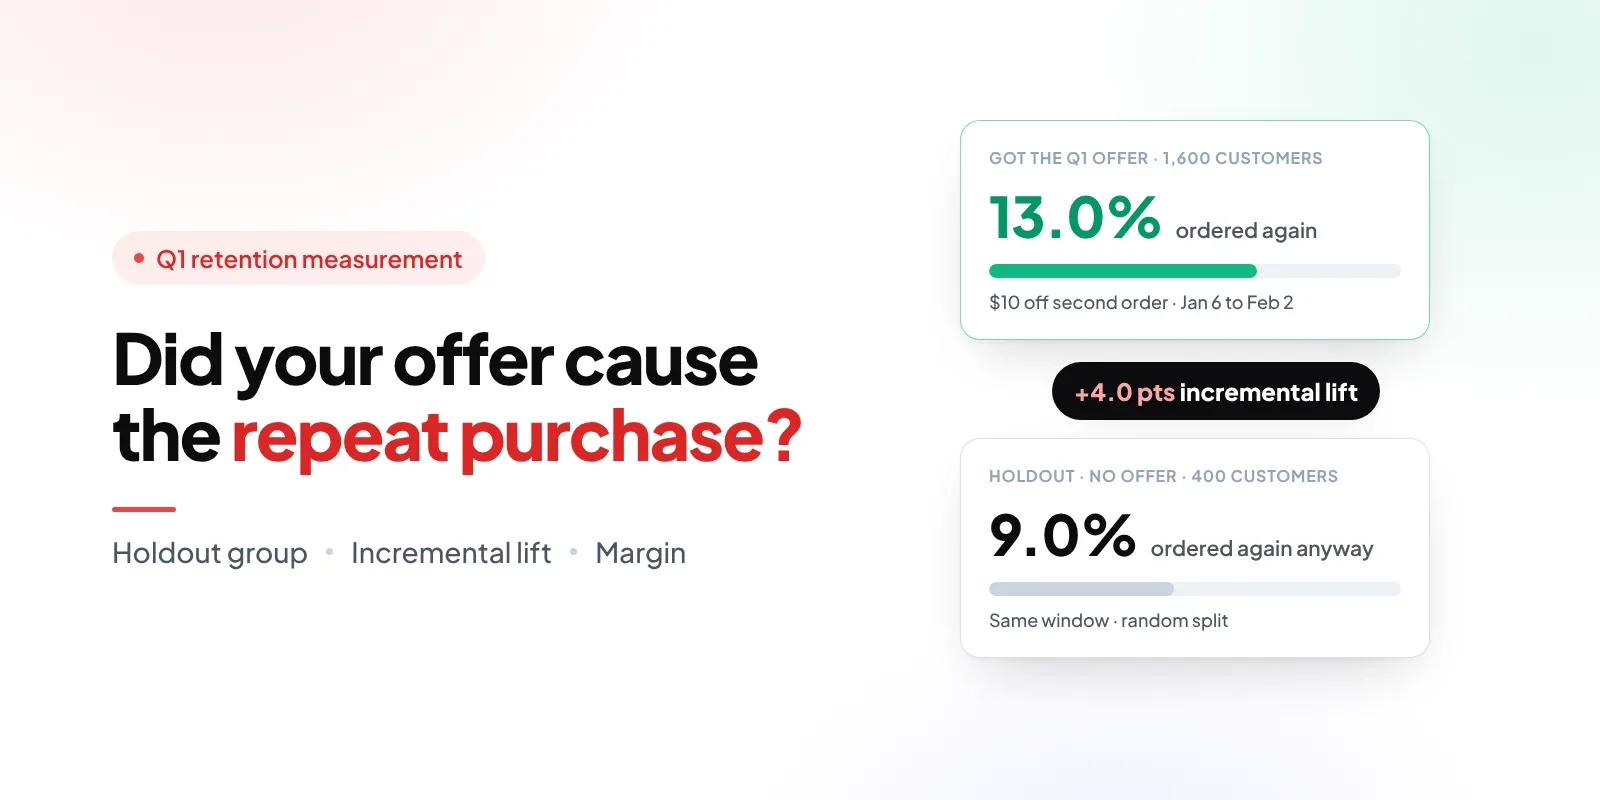
Here's the Holdout Scorecard for an illustrative store with 2,000 BFCM first-time buyers. It sent $10 off a second order to 80% of them and held back 20%, then measured from January 6 to April 5.
Exposed group | Holdout group | |
|---|---|---|
Customers | 1,600 | 400 |
Customers who ordered again | 208 | 36 |
Repeat purchase rate | 13.0% | 9.0% |
Orders that used the code | 176 | 0 |
Incentive cost | $1,760 | $0 |
Contribution before discounts ($31.50 per order) | $6,552 | $1,134 |
Contribution after discounts | $4,792 | $1,134 |
Contribution per customer | $2.995 | $2.835 |
Now the results:
Incremental repeat-purchase lift: 13.0% minus 9.0% = 4.0 points.
Incremental repeat customers: 4.0% × 1,600 = 64.
Incremental contribution: ($2.995 minus $2.835) × 1,600 = $256.
Cost per incremental repeat customer: $1,760 ÷ 64 = $27.50, against $31.50 of margin on a typical order.
The redemption report would have shown 176 orders and about $12,300 in sales on the code. The real gain was 64 customers and $256 in contribution. The offer worked, just barely, and it cleared the 3.5-point break-even lift by half a point.
Notice that 32 people in the exposed group came back without using the code. The redemption report misses them. The holdout comparison counts them.
There's also noise to account for. With these group sizes, the 95% range for the lift runs from about 0.7 to 7.3 points. That means the true result could be anywhere from a loss to a solid gain. A sensible decision is to keep the offer, test a cheaper version next time, and check the full-price repeat rate for both groups through May before scaling it up.
How Big Does Your Holdout Group Need to Be?
Bigger than most stores expect. When repeat rates are low, small lifts need thousands of customers per group before you can tell them apart from chance.
The table shows roughly how many customers each group needs to reliably detect a lift, using standard settings (95% confidence and 80% power, with equal-sized groups).
Holdout repeat rate | Exposed repeat rate you hope for | Customers needed in each group |
|---|---|---|
8% | 10% | about 3,200 |
8% | 11% | about 1,500 |
8% | 12% | about 880 |
8% | 13% | about 590 |
15% | 20% | about 900 |
20% | 25% | about 1,100 |
Some practical rules follow from this:
Holdout size. With tens of thousands of eligible customers, a 10% to 20% holdout is enough. With a few hundred to a couple of thousand, use 30% to 50%, because a tiny holdout makes the whole test noisy.
Test length. Run for at least 60 to 90 days, or one natural repurchase cycle for your products, so slow buyers have time to come back.
Repeat the test. Run the same split on two or three campaigns and add the results together. Pooled tests give a clearer answer than one big guess.
When you're too small. If each group would have only a few hundred customers, you can still run a holdout, but treat the result as a direction, not proof. Prefer cheap offers while you learn, since the downside of being wrong is smaller.
Where Shopify Rollouts Fits, and Where a Customer Holdout Fits
Shopify Rollouts and a customer holdout answer different questions. Rollouts compares storefront visitors over days or weeks, while a customer holdout follows known customers over months.
Since October 2, 2026, Shopify Rollouts can include discounts, and an experiment can split store traffic between a treatment and a control. According to Shopify's rollout analytics documentation, visitors are assigned by a browser cookie, so the same person on a new device can land in a different group. Experiment results focus on conversion metrics, discount-specific metrics aren't available, Shopify POS and headless storefronts aren't included, and experiments require the Grow plan or higher.
That makes Rollouts a good fit for testing a Shopify discount with Rollouts on the storefront, such as which BFCM offer converts better this week. A Q1 retention offer is different. It goes to named customers by email, the second order can happen on any device or channel, and the result you care about is repeat purchases and margin over 60 to 90 days. For that, a tag-based customer holdout is the better tool.
Where DiscountRay Fits, and Where It Doesn't
DiscountRay, a Shopify discount app by EFOLI, can run the offer for your exposed group. It doesn't measure the result. Shopify data and your spreadsheet or analytics tool do that part.
Here's where it helps in this method:
Offers for one tag only. On the Growth plan, DiscountRay supports pricing by customer tag, so you can limit the offer to customers tagged
q1-26-offer.Codes that can't leak. Personalized single-use codes are tied to one customer: the buyer's email must match, and the code works once. That keeps holdout customers from using a shared code.
Fixed dates. You can schedule the offer's start and end dates, so the window is the same for every exposed customer.
Richer conditions. On the Pro plan, personalized discounts by tag or customer list can also use cart value, country, and order history, with a fixed amount, percentage, free shipping, or free gift as the reward.
And here's what it doesn't do: it doesn't split customers into groups, calculate lift, or report incremental revenue. It's not an experimentation tool, so read your results from Shopify segments and the orders export. Growth is $14 a month and Pro is $29 a month, both with a 14-day free trial, as listed on DiscountRay's pricing page.
Who You Should Never Put in a Holdout
Only hold out customers from offers that are optional. If a customer is owed something, giving it to them matters more than a clean test.
Customers owed service recovery. Someone whose order arrived late or broken should get the fix you'd normally give.
B2B accounts with agreed pricing. Contract or price-list terms aren't a test variable.
Promised rewards. If you advertised a reward, such as a loyalty perk or a "second order discount" printed in the box, everyone who qualifies gets it.
Common Mistakes
Hand-picking the holdout. If you hold back "less engaged" customers, the holdout will look worse no matter what, and the offer will look better than it is.
Comparing redeemers with non-redeemers. People who redeem were already more interested. Always compare the whole exposed group with the whole holdout.
Letting codes leak. A public or shareable code can reach holdout customers through coupon sites. Use customer-locked codes and watch for discount code sharing.
Changing the offer mid-test. Raising the discount after two slow weeks turns one test into two half-tests.
Stopping at the first good week. Early results swing a lot. Decide the end date before you start and keep it.
Reading totals instead of rates. The exposed group is bigger, so it will always have more orders. Compare per customer.
Forgetting refunds and the post-offer period. A returned second order isn't a repeat purchase, and a January win can turn into an April dip in full-price orders.
Turning the Result Into Your Next Q1 Decision
Use the result to change one thing at a time. Compare the lift with your break-even lift, then look at how wide the range is.
What you found | What to do next |
|---|---|
Lift is above break-even and the range stays above zero | Keep the offer. Roll it out to a larger share and keep a small holdout. |
Lift is above break-even, but the range includes zero | Repeat the test with a bigger holdout before scaling. |
Lift is positive but below break-even | Make the offer cheaper, such as free shipping instead of $10, or narrow it to less likely returners. |
No lift | Stop the offer. Keep sending the message without the discount. |
The goal is a lower cost per incremental repeat customer over time. That number is also the fairest way to weigh a targeted offer against a points program, because it compares the cost per extra repeat order instead of the number of rewards handed out.
Conclusion
A retention offer earns its place only if it brings back customers who wouldn't have returned on their own, at a cost the extra margin can cover. Redemptions can't show you that. A random holdout group can.
To measure incremental revenue from your Q1 offer, work out the break-even lift before you send, split your eligible customers at random, give the offer to one side, and compare the Holdout Scorecard for both groups after 60 to 90 days. Do it once in January, repeat it in spring, and every Q1 offer after that will be built on what actually worked.
How do I know if a discount caused a repeat purchase?
What is a holdout group in ecommerce?
How big should a holdout group be?
How long should a retention offer test run?
Is redemption rate a good measure of a retention offer?
If my email tool attributes revenue to a win-back campaign, how much was incremental?
Can I measure incremental revenue without an analytics app?
Can Shopify Rollouts test retention offers?
Does DiscountRay measure incremental revenue?

Syeda Rehnoma Tanzom
This article is written by Syeda Rehnoma Tanzom, an SEO content writer with 3+ years of experience specializing in eCommerce content. What makes the work here a little different? A close collaboration with support teams to understand what merchants are actually going through, their frustrations, their questions, and their wins. The goal is simple: write content that speaks to real problems, not just search engines. When not buried in keywords and content briefs, you'll find her nose-deep in a good book, binge-watching true crime documentaries or psychological thrillers, and occasionally switching gears with a feel-good rom-com.
This article was reviewed by the DiscountRay Technical Support Team, who regularly helps Shopify merchants test discount setup, customer eligibility, cart behavior, and checkout-related discount issues.